Fault Detection
Fault Detection
Detecting anomalous behavior is the responsibility of this role. It is handled
by a C application, based on the libmtev framework, known simply as "Fault".
The service is called circonus-fault-detection. Its configuration files are
located in /opt/circonus/etc, and logs are in /var/log/circonus.
Operations UI
Fault offers an operations UI at http://FAULT_DETECTION_NODE_ADDRESS:9127/
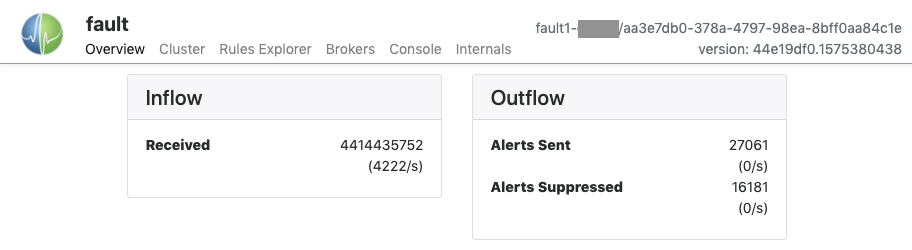
At the top of the page is a list of tab panes, described below. At right are
displayed the hostname and cluster UUID of the node, as well as the software
version, in the format [commit_hash].[timestamp].
Overview Pane
The Overview pane shows counts and rates for incoming MQ messages and outgoing alerts, both sent and suppressed. The counts reset when the service restarts.
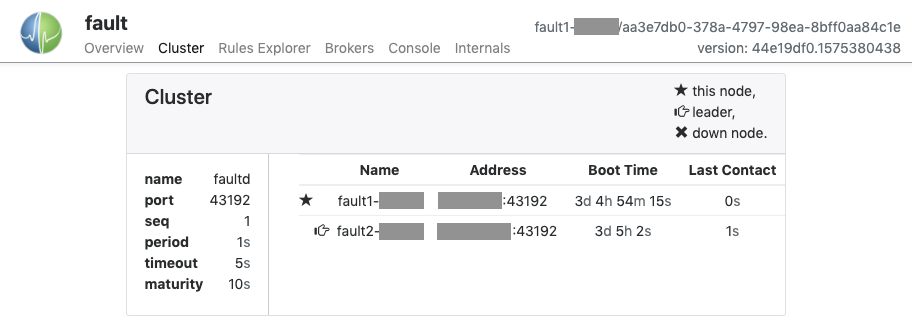
Cluster Pane
The Cluster pane displays information about the Fault cluster. Cluster membership is displayed as a list denoting the Name, IP Address, Boot Time, and Last Contact time for each node. The star icon indicates the node that is currently being viewed. The pointing hand icon indicates which node is currently the cluster leader, which is the node that has been up the longest. An "X" icon indicates a node that is configured as part of the cluster but is not responding to cluster messages.
Rules Explorer Pane
The Rules Explorer pane allows the operator to display the live state of one or more rulesets in the fault detection system.
Rulesets may be located in one of four ways:
- ECID (Event Criteria ID): A number that identifies a particular ruleset. The
ECID is part of the URL when viewing the ruleset in the Circonus UI
(
/fault-detection/rules/[ecid]), and is contained in the_cidvalue in the corresponding Circonus API object (/rule_set/[ecid]). - Account ID: The numeric identifier of an account. Account IDs can be found using the Account Admin page.
- Check UUID: The UUID of the check that collects the ruleset's metric(s). Note: for pattern-based rulesets, it is often easier to use one of the other search methods.
- Metric Name: The canonical name of a metric that is used in the ruleset. Each ruleset found by the search will be displayed below the search box.
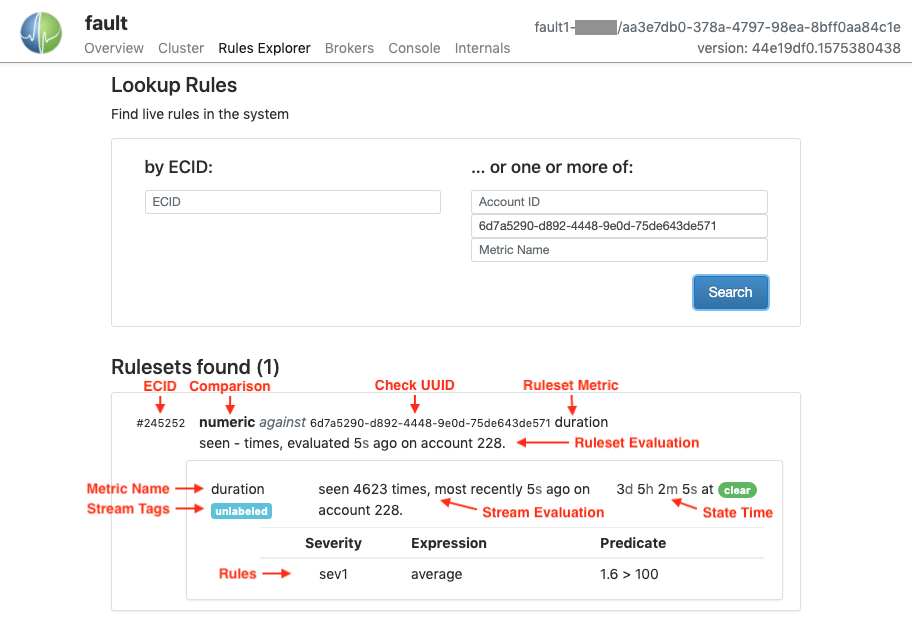
Each ruleset found will be listed, identified by its ECID. Information about the ruleset as a whole is displayed at this level:
- ECID: The ruleset's identifier.
- Comparison: The type of comparison being performed, e.g., "numeric" or "text".
- Check UUID: (single-metric rulesets only) The check to which the ruleset's metric stream belongs. Shown with individual metrics for pattern-based rulesets (see below.)
- Ruleset Metric: (single-metric rulesets only) The canonical metric name. Not shown for pattern-based rulesets.
- Ruleset Evaluation: Elapsed time since the ruleset was last evaluated, and the associated account ID.
Within each ruleset, associated metrics are listed. For pattern-based rulesets, it is possible that no metrics matching the pattern have been seen, so none will be listed. Per-metric information displayed:
- Check UUID: (pattern-based rulesets only) The check to which the metric stream belongs. Shown in the enclosing ruleset information for single-metric rulesets (see above.)
- Metric Name: The metric's base name, excluding stream tags.
- Stream Tags: Any tags that are part of the canonical metric name, or "unlabeled" if no stream tags are present.
- Stream Evaluation: The number of times the metric stream has been seen, the elapsed time since it was last seen, and the account ID to which the stream belongs. If the metric has not been seen since the Fault node booted, a dash ("-") will be displayed for the count value.
- State Time: The length of time that the stream has been in its current state, either "clear" or a particular severity level.
- Rules: The individual rules that make up the ruleset. For each rule the
following information is displayed:
- Severity: The severity level that the rule will trigger.
- Expression: How the current value will be obtained. Depending on the ruleset's configuration, the value could be the result of a windowing function over multiple samples, or could simply be the most recent value received.
- Predicate: The criterion applied to the expression's value. In the example above, the average value at last evaluation was 1.6, which is not greater than 100, so the rule is not triggered, and the metric's state is "clear".
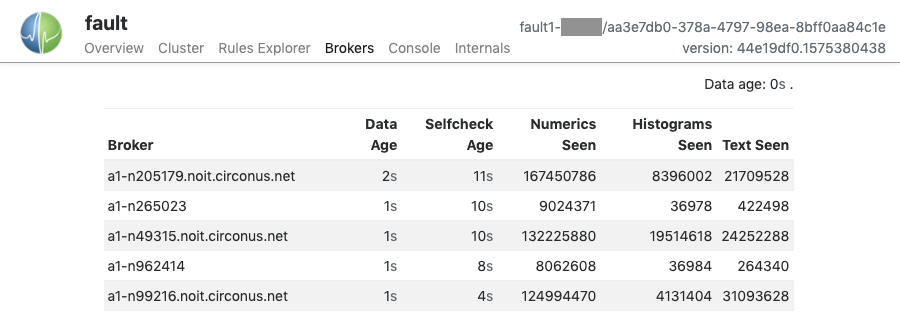
Brokers Pane
The Brokers pane displays all of the brokers from which the Fault node has seen metric records passing over the message queue, since boot. The columns displayed are:
- Broker: the broker's name, as reported in the metric record. This is typically the CN of the broker's TLS certificate.
- Data Age: the difference between the current time on the Fault node and the embedded timestamp in the most recent metric record seen.
- Selfcheck Age: the difference between the current time on the Fault node and the timestamp of the last broker selfcheck record seen.
- Numerics Seen: count of numeric metric records seen by the Fault node since boot.
- Histograms Seen: count of histogram metric records seen by the Fault node since boot.
- Text Seen: count of text metric records seen by the Fault node since boot.
Console Pane
The Console pane allows interaction with the application console, which is also
available via telnet to localhost 32328 on each Fault node. Results of
commands are displayed in the main window, and the text area directly beneath
is used to enter commands. Clicking in this area reveals a list of available
commands. Subcommands will be revealed while typing, or by using tab
completion.
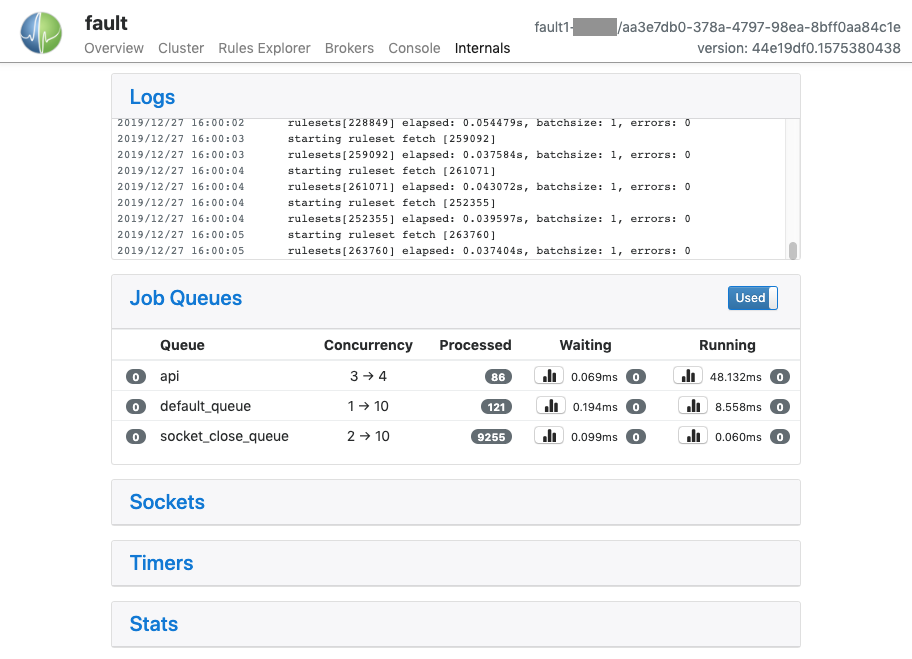
Internals Pane
The Internals pane is mostly of interest to Circonus Support, and displays detailed information about the internal functioning of the software. It has a number of panels:
- Logs shows a live selection of the most recent lines in the
faultd-error.logfile. - Job Queues lists libmtev eventer job
queues
(aka "jobqs"), which are groups of one or more threads dedicated to a
particular task, such as reading from the Circonus API. These tasks may
potentially block for "long" periods of time and so must be handled
asynchronously to avoid stalling the application's event loop.
- Job queues have names that indicate what they are used for, and concurrency attributes that control the number of threads to use in different scenarios.
- At the top right of the Joq Queues panel is a toggle that controls whether to display jobqs currently in use ("Used") or all existing jobqs ("All"). The default is to show only in-use jobqs.
- Each jobq is listed by name and shows the level of concurrency it supports (either a single number or a pair of numbers, which indicates the current number of threads relative to the maximum), the number of events processed through the queue since boot, and statistics on the latencies for events waiting to be run in the queue and time spent actually running.
- Sockets displays information on active sockets. These include both internal file descriptors for the libmtev eventer system, as well as network connections for REST API listeners and clients.
- Timers displays information on timed events. Fault does not make extensive use of timed events so this panel is often empty.
- Stats displays all statistics application statistics that have been
registered into the system. These are collected and maintained by the
libcircmetrics library.
Statistics accumulate over the lifetime of the process, and are reset when
the process restarts.
- At the top of the panel is a Filter field where you can enter a substring or regex pattern to match statistics. Only those statistics matching the pattern will be displayed. This is a useful way to narrow down the list of statistics, which can be quite long.
Ernie
Note: This service is deprecated and will be removed in a future release.
The rule processing function is now performed by the Fault service, described above. The "Ernie" service still serves its secondary role as the Composite Check broker. If you are using Composite checks, they must be converted into CAQL checks as soon as possible.
The composite broker role is handled by a Java service named circonus-ernie. This process listens on ports 43191 and 8092. Port 43191 is connected to by stratcons and web servers to collect composite data and configure the checks. Port 8092 is a web REST port that exposes internal metrics such as events seen, rules processed, and troubleshooting for rules and composite data.
Logs reside in /var/log/circonus. The current log files are:
ernie.logernie-fire.logernie-debug.log
The ernie-fire and ernie-debug logs are sometimes used to help Support determine the state of the system should a problem arise. The fire logs show state transitions for metrics between "alert" and "cleared" statuses. The debug log currently shows how long it took to process a given metric.
The REST server has 3 major endoints:
http://<HOST>:8092/resmonshows an overview of internal data and is used by Circonus to help monitor itself. The core section shows uptime, leadership status, and CPU time. "Faultrules" shows how many rules have been processed since the service has been up, and "firehose" shows how many messages have passed through the system.http://<HOST>:8092/admin/rules/<account_id>/<check_uuid>/<metric_name>shows the currently defined rulesets for a given metric. To determine the account_id, visit the admin interface and search for the account in question. For the check_uuid, run the following command in the web database using the ID from the URL in the web UI:
select check_uuid from circonus.checks where check_id = <ID>;
http://<HOST>:8092/composite/<check_uuid>gives a breakdown of the composite equation and what the current value is. As with the check_uuid in the previous step, the composite UUID can be gathered with the same query using the ID from the web UI.
Fault Detection PKI Files
/opt/circonus/etc/ernie/ca.crt/opt/circonus/etc/ernie/ernie.crt/opt/circonus/etc/ernie/ernie.key
Note:
Java does not make use of the individual files directly; instead it uses the "keystore" file. If this file does not exist, refer to the install manual and rerun
run-hooperon this node.
JLOG_ERR_META_OPEN
If Fault Detection is stuck in maintenance mode after a Data Center Failover, check the logs for ernie. You may see a message like this:
[main]: com.omniti.labs.jlog$jlogIOException: JLOG_ERR_META_OPEN
com.omniti.labs.jlog$jlogIOException: JLOG_ERR_META_OPEN
        at com.omniti.labs.jlog.open_writer(Native Method)
        at net.circonus.ernie.ErnieJournal.getWriter(ErnieJournal.java:82)
        at net.circonus.ernie.ErnieJournal.selfReport(ErnieJournal.java:65)
        at net.circonus.ernie.Ernie.<init>(Ernie.java:215)
        at net.circonus.ernie.Ernie.main(Ernie.java:349)
Check the /var/log/circonus/ernie-feed.jlog/ directory. If the "metastore" file is missing, empty, or otherwise malformed, this indicates that the file was created incorrectly.
If there are multiple data files, that would have hex filenames like:
00000009
0000000a
0000000b
...
Then you should repair your metastore file like so. In this command we will use the filename that is the most recent, in the above list that would be b.
perl -e 'print pack("IIII", 0xLATEST_FILE_HERE, 4*1024*1024, 1, 0x663A7318);' > metastore
If there are no data files or just one that is small, you can delete the
/var/log/circonus/ernie-feed.jlog/ directory and start ernie:default to recreate it.
Composite Check Troubleshooting
Composite checks are run on the fault detection nodes. Stratcon connects to this node and treats it as a broker, so some typical broker troubleshooting (see that section) may be needed if the composite shows as down or disconnected.
If you have a composite check that appears to be configured correctly yet you are not seeing data, you can go to the fault detection node in a browser to see the raw details of what it believes the check looks like:
http://FAULT_DETECTION_NODE_ADDRESS:8092/composite/CHECK_UUID
Note that you need to provide the UUID which can be found either in the UI or the API.
If you believe that composites are not processing at all, you can look at:
http://FAULT_DETECTION_NODE_ADDRESS:8092/composite/queue
To see the current check being processed and if the queue is "stuck".
If you have questions on the output, please contact support@circonus.com