MQ
The Circonus Message Queue (MQ) role is the center for most message passing among systems such as stratcon, fault detection, notification, and others.
The MQ role consists of two different daemons, forming two "planes" or aspects of handling messages:
- FQ is the data plane, which consists of the actual metric data flowing through the system.
- RabbitMQ is the control plane, consisting of signaling messages between components, such as Fault Detection signaling to Notification that a new alert has fired.
FQ
Services:
circonus-fq
FQ is a brokered message queue from Circonus Labs using a publish-subscribe model. FQ is fast and performance-oriented. Messages come in, FQ determines where to send them, and the messages go out.
Additional documentation about FQ can be found on the Circonus Labs Github Repository.
FQ User Interface
The FQ User Interface can be accessed by visiting the node on port 8765 in your browser.
The auto-updating console has 3 tabs, Overview, Queues, and Routes.
Overview
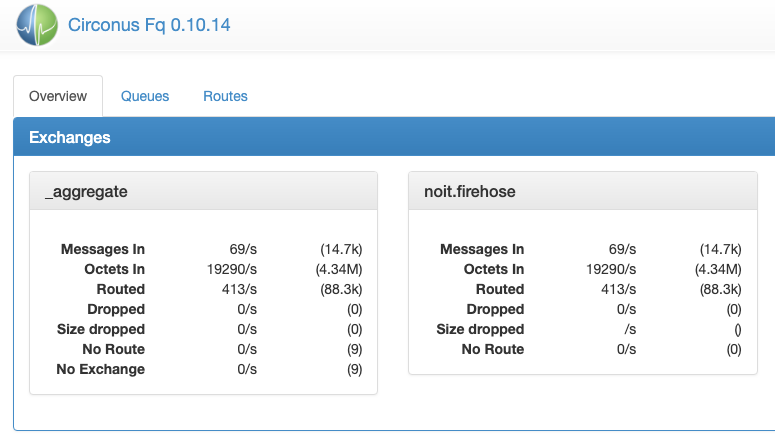
The Overview tab lists the active exchanges as well as aggregate statistics of all exchanges. In each panel, the first column of statistics is a live snapshot of the rate of various events in the system, and the second is the total seen since the FQ node booted.
The only exchange used in Circonus Inside is
noit.firehose.
Queues
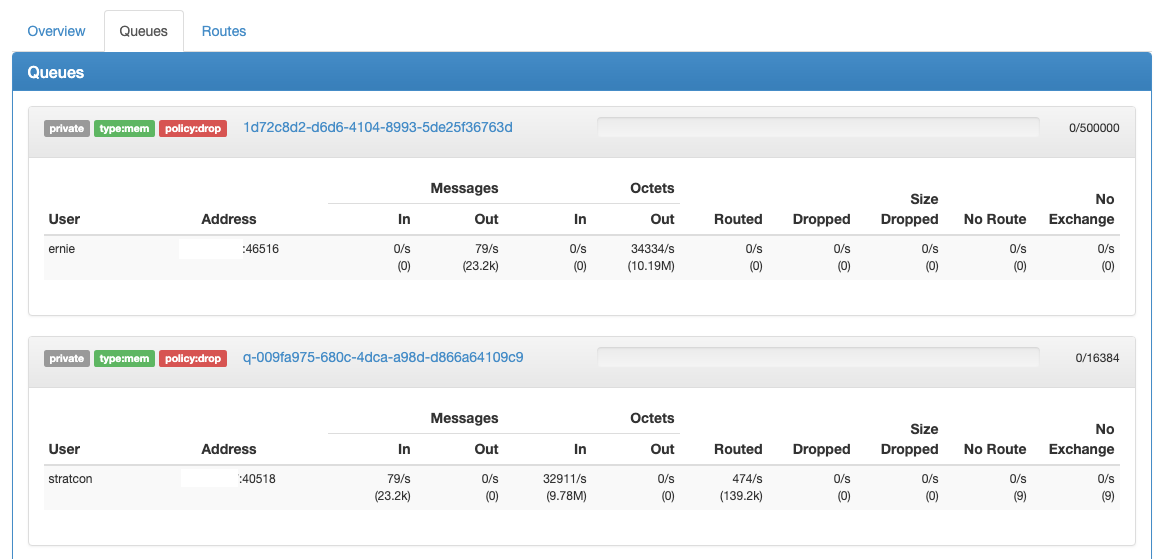
The Queues tab lists the queues that have been established, one panel per queue. Each panel lists information about the queue at the top, including an indicator bar of in-flight messages. To the right of the indicator bar is a count of in-flight messages and the total size of the queue.
Warning:
If the bar fills up and changes from green to orange, this indicates that the queue is full and messages are being lost.
Routes
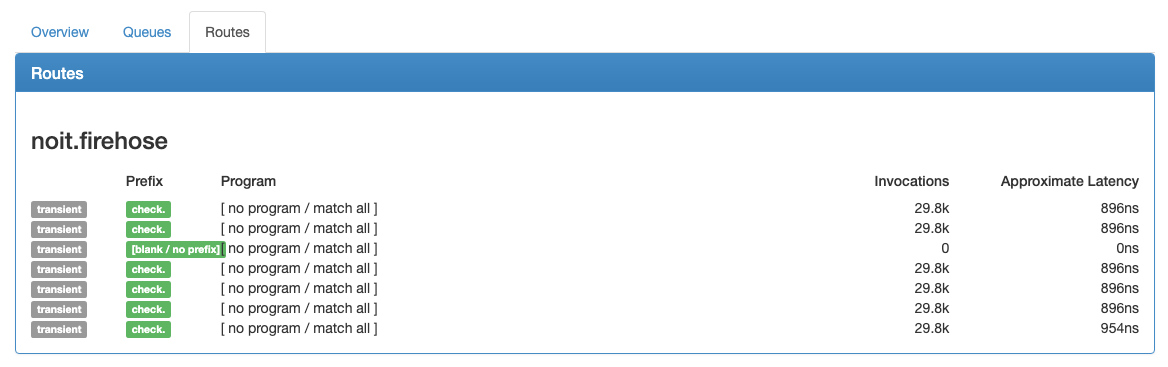
The Routes tab lists the known routes that senders have established.
JSON Metric Outputs
The same information in the UI is also available in JSON form from
/stats.json.
Example FQ JSON stats output:
{
 "version": "0.10.14",
 "exchanges": {
   "noit.firehose": {
     "messages": 79935499,
     "octets": 37989734444,
     "no_route": 57518,
     "routed": 80546043,
     "dropped": 80465039,
     "routes": {
       "24": {
         "route_id": 24,
         "prefix": "check.",
         "queue": "655dd8dc-78f1-4921-80c4-83f6b9f3bcc1",
         "permanent": false,
         "invocations": 2543822,
         "avg_ns": 298,
         "program": "prefix:\"check.\""
       },
       "25": {
         "route_id": 25,
         "prefix": "",
         "queue": "655dd8dc-78f1-4921-80c4-83f6b9f3bcc1",
         "permanent": false,
         "invocations": 1381540,
         "avg_ns": 189,
         "program": "prefix:\"\""
       }
     }
   },
   "_aggregate": {
     "no_exchange": 18,
     "messages": 79935517,
     "octets": 37989747476,
     "no_route": 57536,
     "routed": 80546043,
     "dropped": 80465039
   }
  },
  "queues": {
    "655dd8dc-78f1-4921-80c4-83f6b9f3bcc1": {
     "private": true,
     "type": "mem",
     "policy": "drop",
     "backlog_limit": 16384,
     "backlog": 16384,
     "refcnt": 9,
     "clients": [ {
        "user": "ernie"
        "remote_addr": "10.8.20.52"
        "remote_port": "46335"
        "mode": "peer"
        "no_exchange": "0"
        "no_route": "0"
        "routed": "0"
        "dropped": "0"
        "msgs_in": "0"
        "msgs_out": "477"
        "octets_in": "0"
        "octets_out": "325879"
      } ]
    }
  }
}
The "exchanges" section will have entries for all of the defined exchanges. The "_aggregate" entry is additive of all the listed exchanges.
Snooping the FQ
The FQ package contains a utility, fq-receiver, that can be used to monitor
the message queue and optionally extract specific metric records for viewing.
This is useful to determine that a particular metric is included in the
ingestion pipeline.
The utility is written in Lua, so ensure that the
circonus-platform-runtime-luajit package is installed, and that
/opt/circonus/bin is in your shell's PATH.
The simplest invocation, which produces the largest amount of output, is to show every message transiting the exchange:
/opt/circonus/bin/fq-receiver --host localhost --exchange noit.firehose
Use Ctrl-C to exit the program.
Each metric record appears on one line, with tab-delimited fields. The first field indicates the record type:
Mrecords include a single numeric measurement for exactly one metric stream.B2records bundle multipleMrecords, stored as a base64-encoded payload.H1records include a single, base64-encoded histogram for exactly one metric stream.Srecords are status records and generally not of interest while troubleshooting.
To narrow the output based on a known account and/or check ID, use the
--program option to specify a filter. For example, to see all metrics for
account 2061:
/opt/circonus/bin/fq-receiver \
    --host localhost \
    --exchange noit.firehose \
    --program 'prefix:check.1.2061'
To further restrict to a specific check ID, the program would be
prefix:check.1.2061.75940 for check ID 75940.
RabbitMQ
Services:
circonus-epmd(Erlang port-mapper)circonus-rabbitmq(RabbitMQ itself)
Logs are in /var/log/circonus/rabbitmq.
Additionally, RabbitMQ has a management interface running on port 55672,
accessible in your browser with the username/password: guest/guest. RabbitMQ
also has a management tool locally on the box:
/opt/rabbitmq/sbin/rabbitmqctl.
The management UI in the browser is the recommended method for data gathering. From this tool, you can see the state of the cluster, connected clients, exchanges, queues and message rates, etc.
Restarting RabbitMQ
If a node in the cluster is offline, the preferred method of restarting it is
to first ensure that both the circonus-rabbitmq and circonus-epmd service
have both been stopped.
Start circonus-epmd first, then start circonus-rabbitmq. Once both have
been started, then via the management interface you should see a process
running on the local box and see the node reconnect to the cluster.
Further RabbitMQ documentation can be found on their site: http://www.rabbitmq.com/documentation.html