Operations
By default, IRONdb listens externally on TCP ports 2003 and 4242, TCP and UDP port 8112, and locally on TCP port 32322. These ports can be changed via configuration files. There are normally two processes, a parent and child. The parent process monitors the child, restarting it if it crashes. The child process provides the actual services, and is responsible for periodically "heartbeating" to the parent to show that it is making progress.
IRONdb is sensitive to CPU and IO limits. If either resource is limited, you may see a process being killed off when it does not heartbeat on time. These are known as "watchdog" events.
Service Management
The IRONdb service is called circonus-irondb.
To view service status: /bin/systemctl status circonus-irondb
To start the service: /bin/systemctl start circonus-irondb
To stop the service: /bin/systemctl stop circonus-irondb
To restart the service: /bin/systemctl restart circonus-irondb
To disable the service from running at system boot: /bin/systemctl disable circonus-irondb
To enable the service to run at system boot: /bin/systemctl enable circonus-irondb
Logs
Log files are located under /irondb/logs and include the following files:
- accesslog
- errorlog
- startuplog
The access logs are useful to verify activity going to the server in question.
Error logs record, among other things, crashes and other errant behavior, and
may contain debugging information important for support personnel. The startup
log records various information about database initialization and other data
that are typically of interest to developers and operators. Logs are
automatically rotated and retained based on configuration attributes in
/opt/circonus/etc/irondb.conf.
If the child process becomes unstable, verify that the host is not starved for
resources (CPU, IO, memory). Hardware disk errors can also impact IRONdb's
performance. Install the smartmontools package and run /usr/sbin/smartctl
-a /dev/sdX, looking for errors and/or reallocated-sector counts.
Crash Handling
Application crashes are, by default, automatically reported to Circonus, using Backtrace.io technology. When the crash occurs, a tracer program quickly gathers a wealth of detailed information about the crashed process and sends a report to Circonus, in lieu of obtaining a full core dump.
If you have disabled crash reporting in your environment, you can still enable traditional core dumping.
On EL7:
- Add the following to
/opt/circonus/etc/irondb-node-config:ulimit -c unlimited - Restart the
circonus-irondbservice - Set the kernel core pattern to place core dumps in a suitable location. See the core(5) man page for details. This location must be writable by the user that IRONdb runs as (
nobody). - Allow setuid dumps:
sysctl -w fs.suid_dumpable=1
When a process crashes, a core dump will be created in /irondb/appcrash with the filename core.<executable-name>.<pid>, and the event will be recorded in the system log.
(TODO: Ubuntu)
Debugging Mode
If instability continues, you may run IRONdb as a single process in the foreground, with additional debugging enabled.
First, ensure the service is disabled: /usr/bin/systemctl stop circonus-irondb
Then, run the following as root:
/opt/circonus/bin/irondb-start -D -d
Running IRONdb in the foreground with debugging should make the error apparent, and Circonus Support can help diagnose your problem. Core dumps are also useful in these situations (see above).
Replication
In a multi-node cluster, IRONdb nodes communicate with one another using port 8112. Metric data are replicated over TCP, while intra-cluster state (a.k.a. gossip) is exchanged over UDP. The replication factor is determine by the number of write copies defined in the cluster's toplogy. When a node receives a new metric data point, it calculates which nodes should "own" this particular stream, and, if necessary, writes out the data to a local, per-node journal. This journal is then read behind and replayed to the destination node.
When a remote node is unavailable, its corresponding journal on the remaining active nodes continues to collect new metric data that is being ingested by the cluster. When that node comes back online, its peers begin feeding it their backlog of journal data, in addition to any new ingestion which is coming directly to the returned node.
Proxying
Clients requesting metric data from IRONdb need not know the specific location of a particular stream's data in order to fetch it. Instead, they may request it from any node, and if the data are not present on that node, the request is transparently proxied to a node that does have the data. Because nodes can fail and need to catch up with their peers, proxying favors remote nodes that are the most up to date. This is determined from the gossip data, which includes a latency metric, indicating the most recent replication message that this node has seen from each of its peers. The node performing the proxying decides which of the other nodes that own the given metric has the most recent data.
If gossip state is unavailable, such as due to a network partition, the node handling the request may return less recent data, if it proxies to a node that happens to be behind, or none at all, if the requested data is not available locally and all other owning nodes are unavailable.
Operations Dashboard
IRONdb comes with a built-in operational dashboard accessible via port 8112 in your browser, e.g., http://irondb-host:8112. This interface provides real-time information about the IRONdb cluster. There are a number of tabs in the UI, which display different aspects about the node's current status.
Overview Tab
The "Overview" tab displays a number of tiles representing the current ingestion throughput, available rollup dimensions, license information, and storage statistics.
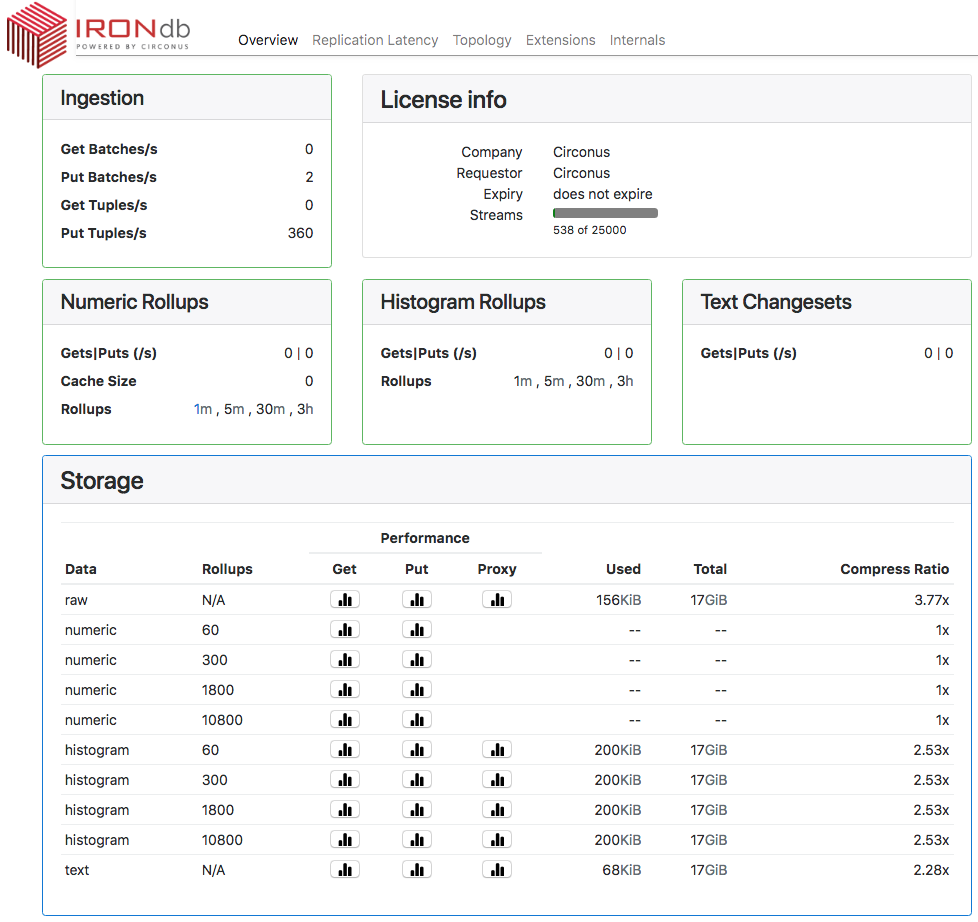
Ingestion
Read (Get) and Write (Put) throughput, per second.
- "Batch" is an operation that reads or writes one or more metric streams.
- "Tuple" is an individual measurement.
Therefore, a write operation that PUTs data for 10 different streams in a single operation counts as 1 Batch and 10 Tuples.
License Info
Displays details of the node's license.
Numeric Rollups
Displays throughput for both reads and writes per second for numeric rollup data.
- "Cache Size" is the number of open file handles for numeric rollup data. A given stream's data may be stored in multiple files, one for each configured rollup period in which that stream's data has been recorded.
- "Rollups" is the list of available rollup periods.
Histogram Rollups
Displays throughput for both reads and writes per second for histogram rollup data.
- "Rollups" is the list of available rollup periods.
Text Changesets
Displays throughput for both reads and writes per second for text data.
Storage
Disk space used and performance data per data type and rollup dimension.
Each icon under "Performance" displays a histogram of the associated operation (Get/Put/Proxy) latency since the server last started. "Get" operations are reads, "Put" are writes, and "Proxy" are operations that require fetching data from a different node than the one which received the request.

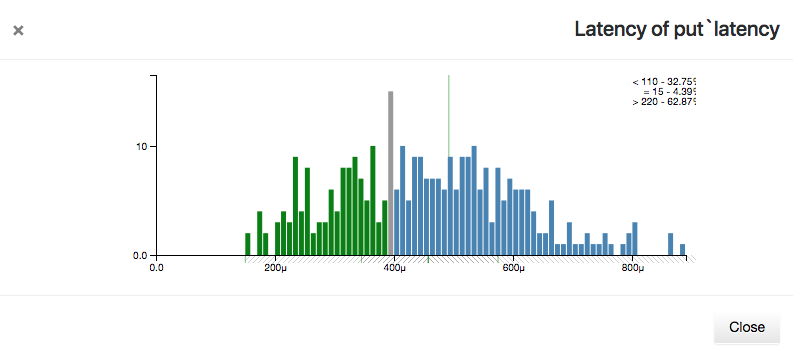
Latencies are plotted on the x-axis as seconds, with suffixes "m" for milliseconds, "μ" for microseconds, and "n" for nanoseconds. Counts of operations in each latency bucket are on the y-axis. The mean latency for the set is displayed as a vertical green line.
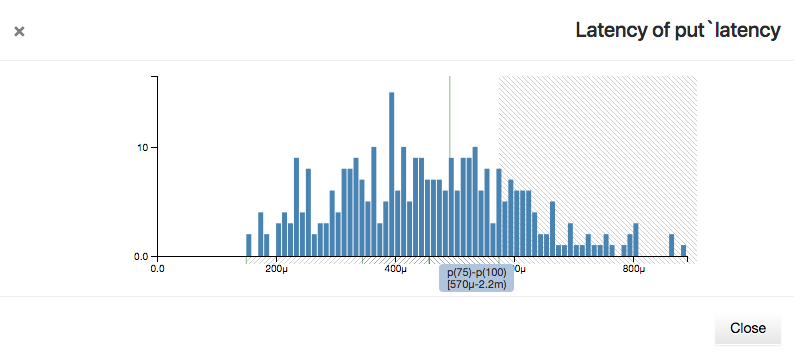
Hovering over the x-axis will display a shaded region representing quantile bands and the latency values that fall within them. The quantiles are divided into four bands: p(0)-p(25), p(25)-p(50), p(50)-p(75), and p(75)-p(100). To avoid losing detail, the maximum x-axis values are not displayed, but the highest latency value may be seen by hovering over the p(75)-p(100) quantile band.
Hovering over an individual latency bar will display three lines at the top right corner of the histogram. These represent the number of operations that had less than, equal to, or greater than the current latency, and what percentage of the total each count represents.
The Used, Total, and Compress Ratio figures represent how much disk space is occupied by each data type or rollup, the total filesystem space available on the node, and the ratio of the original size to the compressed size stored on disk. The compression ratio is determined from the underlying ZFS filesystem.
Replication Latency Tab
Two types of latency are displayed here: "replication latency" and "gossip age". Replication latency is the difference between the current time on each node and the timestamp of the most recently received metric in the journal data from a remote node. Replication status information is exchanged between nodes using "gossip" messages, and the difference between the current time and the timestamp of the last gossip message received is the "gossip age". Gossip messages contain all replication state for a given node relative to all other nodes, so the state of the entire cluster can be seen from any node's UI.
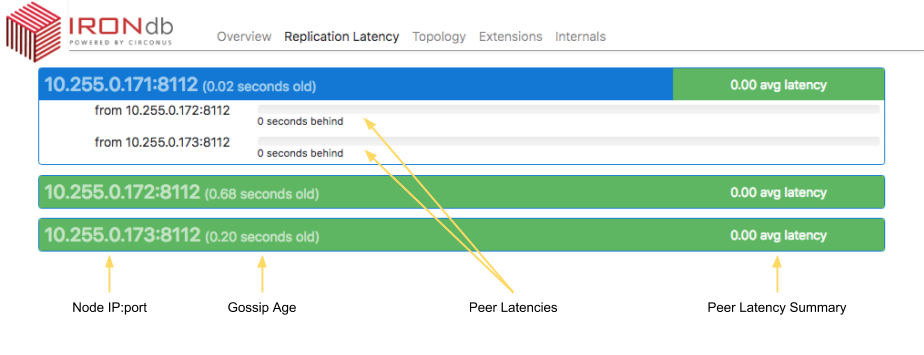
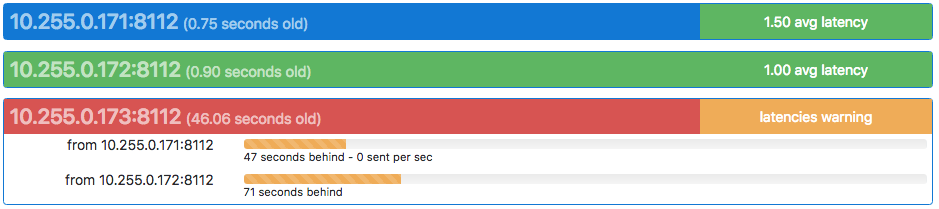
Each node in the cluster is listed in a heading derived from the topology configuration, and a gossip age in parentheses (see below). The node's latency summary is displayed at the right end of the heading line, and is an average of the replication latency between this node and all remote nodes. This is intended as a quick "health check" as to whether this node is significantly behind or not.
Clicking on the heading exposes a list of peer nodes, also from the topology configuration, and a replication latency indicator for each. Each peer's latency may be understood as "how far behind" the selected node is from that peer's current ingestion. In the example above, we can say that node "171" is 0 seconds behind from its peers "172" and "173".
All nodes should be running NTP or similar time synchronization. For example, if a remote node is shown as "(0.55 seconds old)", that means that a gossip message was received from that node 0.55 seconds ago, relative to the current node. Nodes that have persisently high gossip age, or peer latencies that do not drop to zero, may have clock skew.
Packet loss is another possible cause of replication latency. If a remote node's gossip latency varies widely, it could mean that gossip packets are being lost between hosts.
If the current node has never received a gossip message from a remote node since starting, that node will be displayed with a black bar, and the latency values will be reported as "unknown". This indicates that the remote node is either down or there is a network problem preventing communication with that node. Check that port 8112/udp is permitted between all cluster nodes.
Display Colors
Both gossip age and replication latency are also indicated using color.
The heading of the node being viewed will always be displayed in blue.
Gossip ages for remote nodes are colored in the heading as follows:
- Green means a difference of less than 2 seconds
- Yellow means a difference of more than 2 seconds and less than 8 seconds
- Red means a difference of more than 8 seconds
- Black means no gossip packets have been received from the remote host since this host last booted.
Latency summaries in the heading are colored as follows:
- If the node is behind
Wor more nodes by more than 4.5 minutes, then the summary is "latencies danger", and colored red. - If the node is behind
W-1or more nodes by more than 30 seconds, then the summary is "latencies warning", and colored yellow. - Otherwise, the average of all peer latencies is displayed, and colored green.
Replication latency indicators for individual remote nodes are colored as follows:
- Green for less than 30 seconds behind
- Yellow for more than 30 seconds but less than 270 seconds (4.5 minutes) behind
- Red for more than 270 seconds (4.5 minutes) behind
Topology Tab
Displays the layout of the topology ring, and the percentage of the key space for
which each node is primarily responsible (coverage.) The ideal distribution is
1/N, but since the system uses consistent hashing to map metric names to
nodes, the layout will be slightly imperfect.
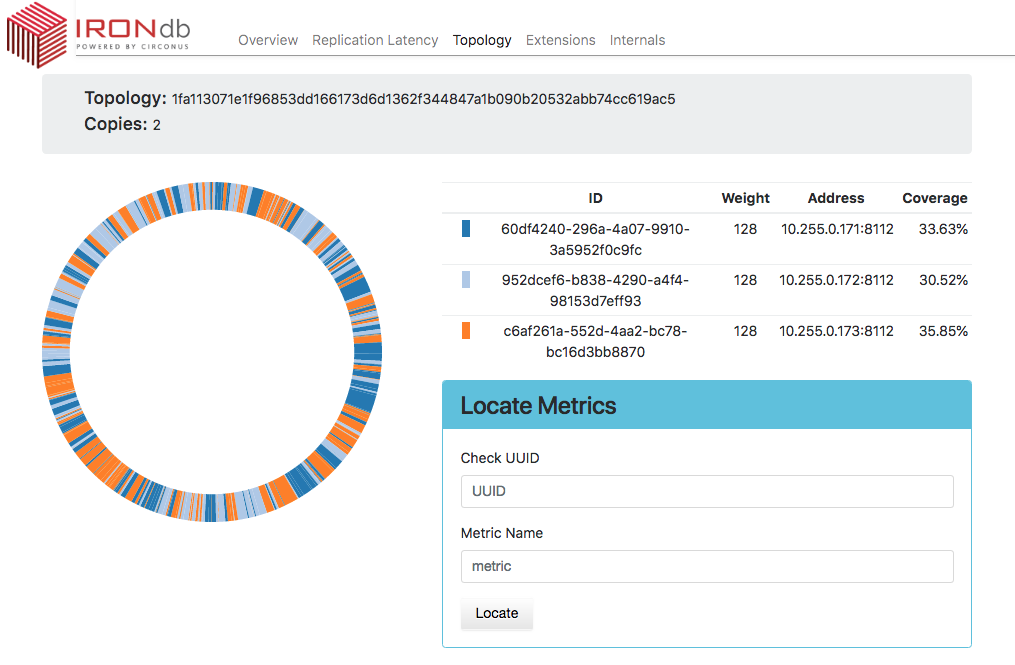
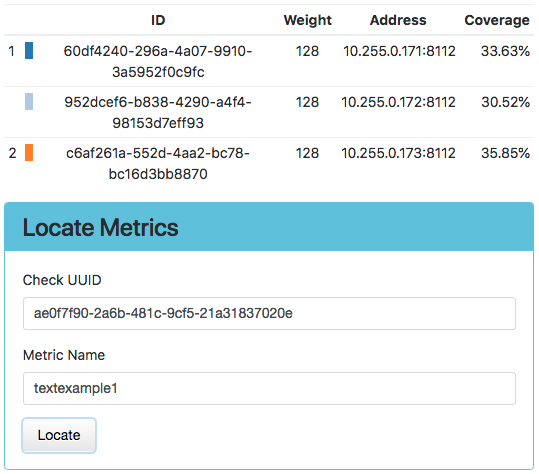
An individual stream may be located by entering its UUID and Metric Name in the Locate Metrics tile, and then clicking the Locate button. Numbers indicating the primary and secondary owners of the metric (or more if more write copies are configured) will appear next to the corresponding node.
Extensions Tab
Displays a list of the loaded Lua extensions that provide many of the features of IRONdb.
Internals Tab
Shows internal application information, which is useful for troubleshooting performance problems. This information is divided into panels by the type of information contained within. These panels are described below.
Logs
The Logs panel of the Internals tab shows recent entries from the errorlog. When the Internals tab is first displayed, the Logs panel is expanded by default.
Job Queues
The Job Queues panel lists libmtev eventer job queues (aka "jobqs"), which are groups of one or more threads dedicated to a particular task, such as writing to the database, or performing data replication. These tasks may potentially block for "long" periods of time and so must be handled asynchronously to avoid stalling the application's event loop.
Job queues have names that indicate what they are used for, and concurrency attributes that control the number of threads to use in different scenarios.
At the top right of the Joq Queues panel is a toggle that controls whether to display jobqs currently in use ("Used") or all existing jobqs ("All"). The default is to show only in-use jobqs.
The toggle first appeared in version 0.15.1
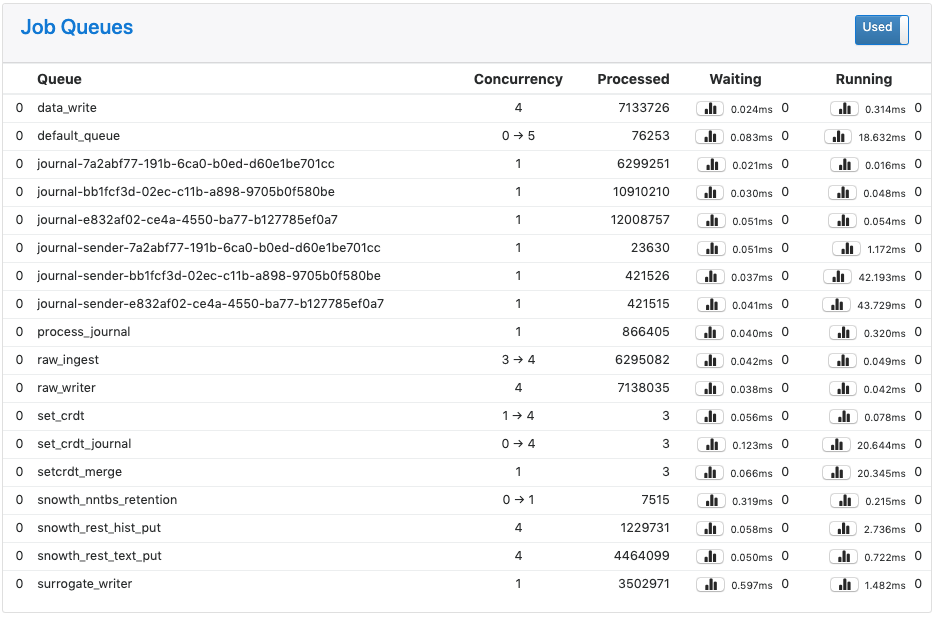
Each row in the panel represents a job queue, with the following columns:
- Queue: the jobq name, preceded by a gauge of jobs that are either in-flight or backlogged (waiting to be enqueued.)
- Concurrency: the number of threads devoted to this jobq. This may be expressed as a pair of numbers separated by an arrow, indicating the current thread count (left) out of a potential maximum thread count (right). It may also be shown as a single number, meaning either that the queue is of a fixed size, or that a dynamic queue is at its maximum concurrency.
- Processed: a counter of jobs processed through this jobq since the application last booted.
- Waiting: information on jobs waiting in the queue. From left to right, three
pieces of information are visible:
- A button for displaying a histogram of wait latencies for the queue, since application boot. This is the same type of histogram as used for Storage latencies in the Overview tab.
- The average time that jobs spent waiting to be processed in the queue, in milliseconds, since the last refresh (5 seconds).
- The instantaneous count of jobs currently waiting in the queue.
- Running: information on jobs actively running in the queue. From left to
right, three pieces of information are visible:
- A button for displaying a histogram of run latencies for the queue, since application boot. This is the same type of histogram as used for Storage latencies in the Overview tab.
- The average time that jobs spent running in the queue, in milliseconds, since the last refresh (5 seconds).
- The instantaneous count of jobs currently running in the queue.
Sockets
The Sockets panel displays information on active sockets. These include both internal file descriptors for the libmtev eventer system, as well as network connections for REST API listeners and clients.
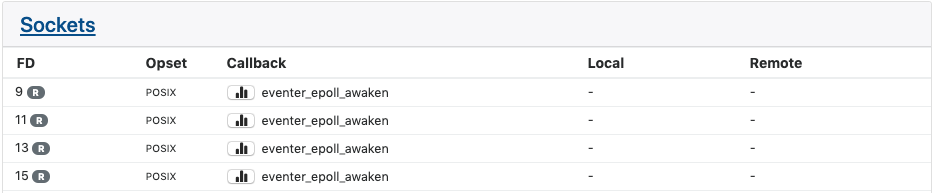
Each row in the panel corresponds to one socket, with the following columns:
- FD: the file descriptor number that corresponds to the socket, and the value of the eventer mask. The mask determines what type of activity will trigger the callback associated with the socket. Typical values are (R)ead, (W)rite, and (E)xception. If multiple values are set, they are separated by a vertical bar.
- Opset: the "style" of socket determines the set of operations that may be
performed on the socket. Typical values are "POSIX", which means the standard
set of POSIX-compliant calls like
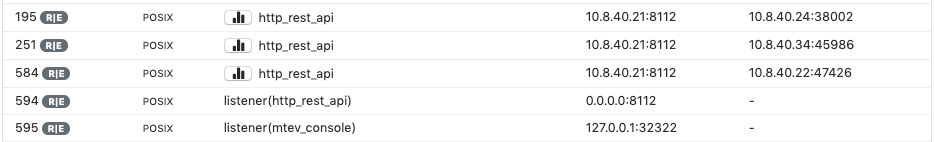
accept()andclose()are available, and "SSL", which adds SSL/TLS operations. The vast majority of sockets in IRONdb will be of the POSIX type. - Callback: the libmtev function that will be called when the socket is triggered by activity matching the socket's mask. For example, if a socket has the Read mask, and there is data on the socket to read, the associated callback function will be invoked to handle reading that data.
- Local: if the socket is part of a network listener or established connection, this will be the IP address and port of the local side of the connection.
- Remote: if the socket is part of a network listener or established connection, this will be the IP address and port of the remote side of the connection.
Network sockets:
Timers
The Timers panel displays information on timed events. IRONdb does not make extensive use of timed events so this panel is often empty.
Each row in the panel lists a timed event, with the following columns:
- Callback: the libmtev function that will be called when the appointed time arrives.
- When: the time that the callback should fire.
Stats
The Stats panel displays all statistics application statistics that have been registered into the system. These are collected and maintained by the libcircmetrics library. Statistics accumulate over the lifetime of the process, and are reset when the process restarts.
At the top of the panel is a Filter field where you can enter a substring or regex pattern to match statistics. Only those statistics matching the pattern will be displayed. This is a useful way to narrow down the list of statistics, which can be quite long.
The filter field first appeared in version 0.15.4.
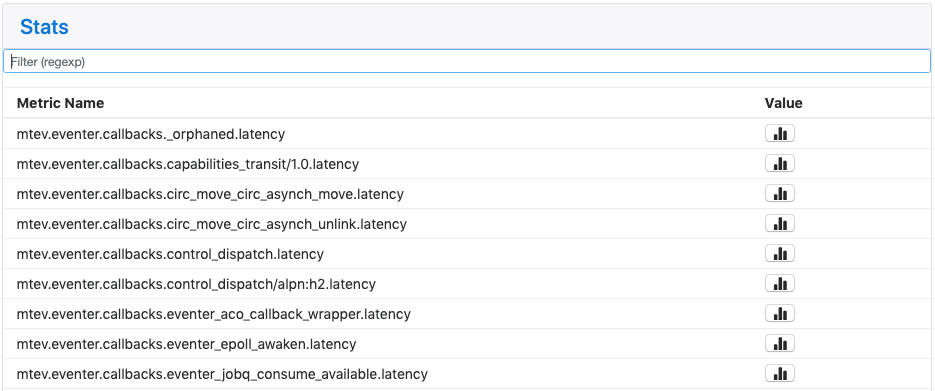
Stats are namespaced to indicate what they represent:
- mtev: internal libmtev statistics
- eventer: stats related to the operation of the event system
- callbacks: each named callback registered in the system gets a "latency" statistic that is a cumulative histogram of all latency values for this callback since boot.
- jobq: each jobq registered in the system gets a set of stats that convey
various information about that jobq. The same information appears in the
Job Queues panel, without the
mtev.eventerprefix. - pool: per-loop statistics for named event loops. Cycletime is a histogram of elapsed time (in seconds) between iterations of the loop. Callbacks is a histogram of all callback latencies witnessed by the loop, also in seconds.
- threads: per-thread cycle times, in seconds.
- memory: memory allocation statistics.
- modules: statistics exposed by libmtev modules.
- pool_N: resource statistics for
mtev_intern,
a facility that reduces application memory usage by allowing multiple
consumers to utilize a single copy of a given string or binary blob. IRONdb
uses
mtev_internin the surrogate_db implementation. - rest: latencies for calls to REST endpoints.
- eventer: stats related to the operation of the event system
- snowth: IRONdb application information. Some stats are used to drive other
parts of the UI, such as GET/PUT counters and histograms in the Overview. All
of these stats are also available at
/stats.json, without thesnowth.prefix.