Grafana Data Source
This is the plugin for IRONdb 0.17.1 and newer. It is evolving and we continue to track its API.
Read more about Circonus IRONdb.
Installation
- The default location for the plugins directory is
/var/lib/grafana/plugins, though the location may be different in your installation, see http://docs.grafana.org/plugins/installation/ for more plugin information.
From Releases
Download the desired release version.
Unzip into plugins directory.
Restart Grafana.
From GitHub
git clone https://github.com/circonus-labs/circonus-irondb-datasource.gitinto plugins directory.Restart Grafana.
Configuration
- Create a new datasource and select IRONdb from the
Typedrop down.
HTTP
URL
- Standalone: If this datasource will access a standalone IRONdb cluster, then
this is the URL where IRONdb can be accessed. Example:
http://nodename:8112, or if TLS is in use,https://nodename:8443. - Hosted: If this datasource will access data through Circonus, then the URL
should be set as:
https://api.circonus.com
IRONdb Details
- Change the IRONdb configuration options at the bottom of the datasource configuration page.
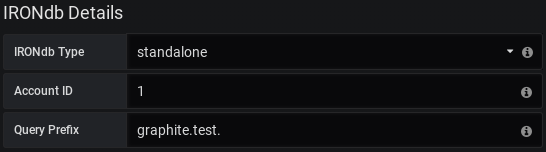
IRONdb Type
- Standalone: An IRONdb cluster accessible directly, requires entry of Account ID.
- Hosted: An IRONdb instance hosted by Circonus, requires entry of API token.
- Depending on which of the above configurations you've chosen, you will either be presented with Account ID or API Token configuration options detailed below.
Account ID
The Account ID associated with the account to pull metrics from.
API Token
The API Token associated with the account to pull metrics from. This can be found on your API Tokens page after logging in at https://www.circonus.com/ in the "Integrations" -> "API Tokens" section.
- Note: Be sure to log into Circonus and change the Grafana App State to "allow" if that isn't the default for the provided API Token.
Usage
- Create a new panel and set the datasource to name selected in the IRONdb datasource configuration.
Standard Queries
For standard Circonus metric queries, use the metric browser to navigate the metric hierarchy of your IRONdb instance or type queries manually using the Toggle Edit Mode menu item to the right.

CAQL Queries
CAQL queries must be entered manually by selecting the CAQL checkbox or switching manually to the editor mode.

Histograms
To visualize a histogram, you must search for the metric using find:histogram, for example:
find:histogram('foobar', 'and(hello:world)') | label('%cn')
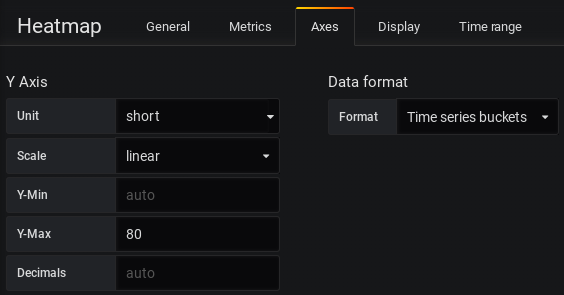
Heatmaps
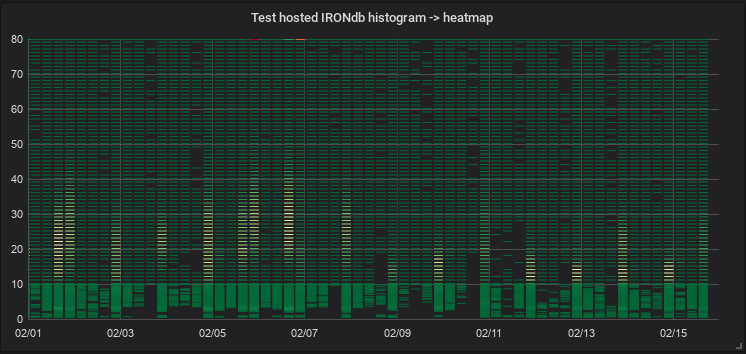
For this processed data to be displayed on the heatmap panel as the sample above, select Time Series Buckets as the Data Format to be used on the Heatmap panel.
Template Variables
How to Configure a Template Variable for IRONdb
From a dashboard, click
Settingsin the top right.On the left hand side, select the
Variablessection.Click
+Newand choose a name for your new variable.Select the proper data source:
IRONdb.Under
Query, enter the metric you wish to use in this variable (without tags).Enable
Include All Optionand enter*forCustom all value.Click
EnabledunderValue groups/tagsto enable tags support.Enter the tag category you wish to use in your variable under
Tag values query.If you successfully completed the prior steps,
Preview of valuesshould now auto-complete the tag values.Finish setup by clicking
Addand thenSave.
Your new template variable should now appear in the query builder!
Development
The build process requires node, npm, yarn, typescrypt, and tslint
On Cent7 setup:
# One time setup
sudo yum install node bzip2
sudo npm install -g typescript tslint
yarn

# Build
yarn build

# Test
yarn test
This content was sourced from the README on GitHub.