Working with Tag Clouds
A tag cloud visualization is a visual representation of text data, typically used to visualize free-form text.
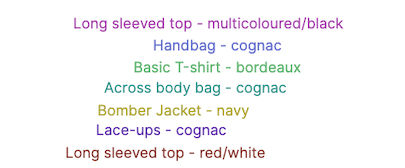
Tags are usually single words, and the importance of each tag is shown with font size or color.
Data
Metrics
The font size for each word is determined by the metrics aggregation.
Buckets
You can specify the following bucket aggregations for tag cloud visualization:
Terms
A terms aggregation enables you to specify the top or bottom n elements of a given field to display, ordered by count or a custom metric.
Parent Pipeline Aggregations
For each of the parent pipeline aggregations, you have to define the metric for which the aggregation is calculated. That could be one of your existing metrics or a new one. You can also nest these aggregations (for example to produce 3rd derivative).
The Derivative aggregation calculates the derivative of specific metrics.
The Cumulative Sum sum aggregation calculates the cumulative sum of a specified metric in a parent histogram.
The Moving Average aggregation will slide a window across the data and emit the average value of that window.
The Serial Diff (differencing) is a technique where values in a time series are subtracted from itself at different time lags or periods.
Sibling Pipeline Aggregations
Just like with parent pipeline aggregations, you need to provide a metric for which to calculate the sibling aggregation.
On top of that, you also need to provide a bucket aggregation that will define the buckets on which the sibling aggregation will run.
The Average Bucket calculates the (mean) average value of a specified metric in a sibling aggregation.
The Sum Bucket calculates the sum of values of a specified metric in a sibling aggregation.
The Min Bucket calculates the minimum value of a specified metric in a sibling aggregation.
The Max Bucket calculates the maximum value of a specified metric in a sibling aggregation.
You can add an aggregation by clicking the + Add Metrics button.
Enter a string in the Custom Label field to change the display label.
The buckets aggregations determine what information is being retrieved from your data set.
Before you choose the buckets aggregation, select the Split Tags option.
The Field specifies the name field that aggregation uses.
Order can be descending or ascending depending on value.
The Size determines the number of tags shown in the cloud. It's based on values and is in effect a Top N filter.
The option Group other values in a separate bucket allows you to group values that are not in the list as defined by size into Other bucket. You can customize the name for the Other bucket.
Show missing values if a document is missing values you group it into a Missing bucket. You can customize the name for the Missing bucket
You can click the Advanced link to display more customization options for your metrics or bucket aggregation:
Select the Options tab to change the following aspects of the chart.
Options
Text Scale allows you to select Linear, Log, or Square root scales for the text scale. You can use a log scale to display data that varies exponentially or a square root scale to regularize the display of data sets with variabilities that are themselves highly variable.
The Orientations allows you to select how to orientate your text in the tag cloud. You can choose one of the following options: Single, right angles or multiple.
Font Size range in pixels allows you to use the slider to set minimum and maximum font sizes to use for this visualization.