Operational Panels
Operational panels in Circonus are collections of visualizations generated using Piped Processing Language (PPL) queries.
Get Started with Operational Panels
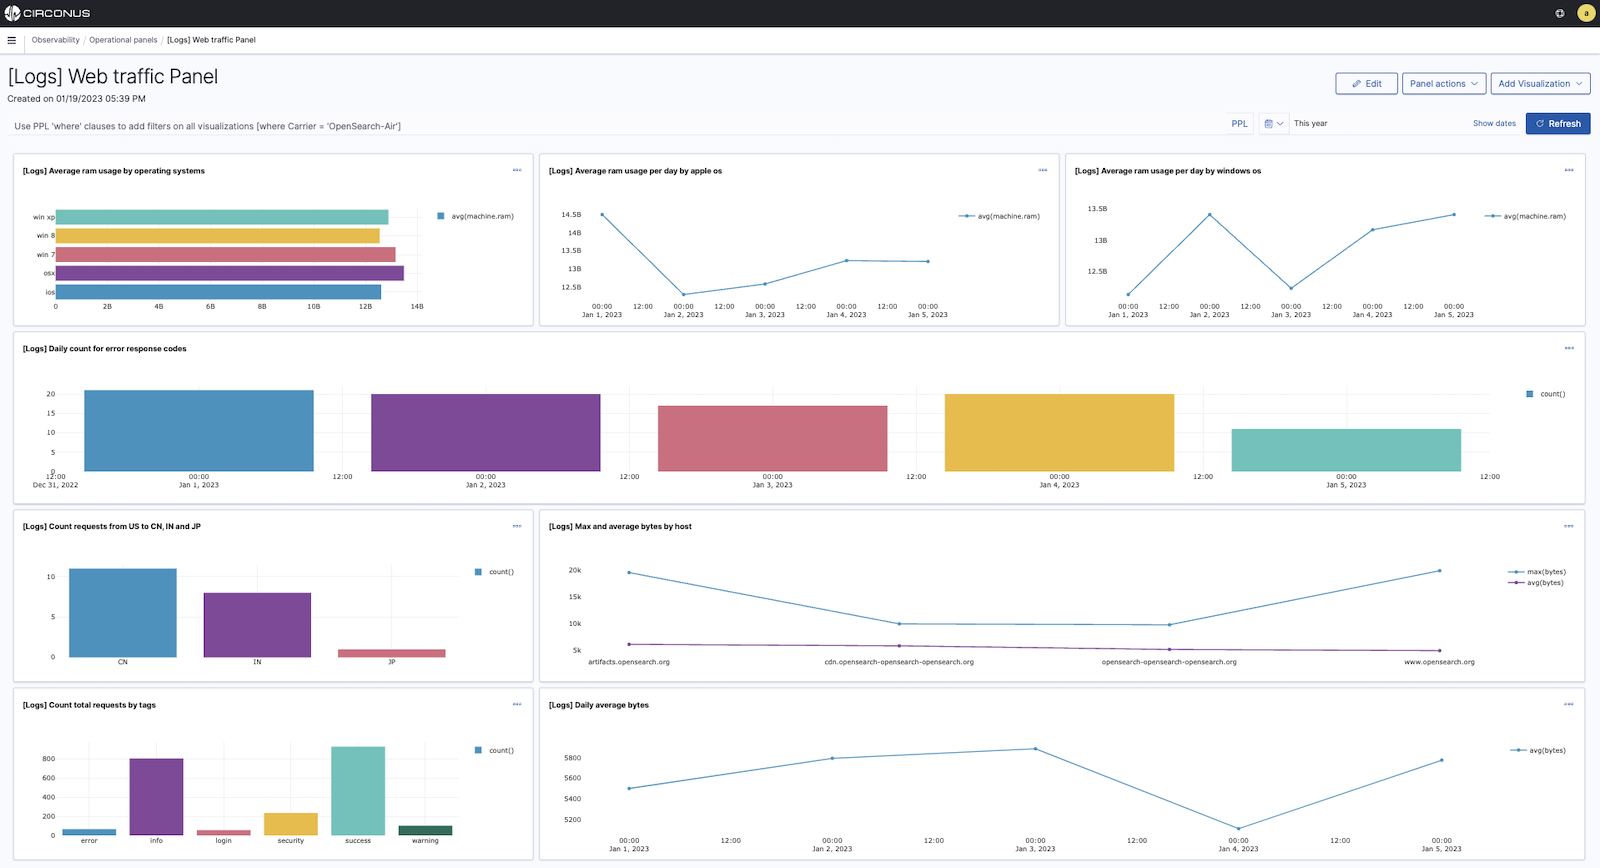
If you want to start using operational panels without adding any data, expand the Action menu and choose Add samples. A set of operational panels with saved visualizations for you to explore will then be added.
Create an Operational Panel
To create an operational panel and add visualizations:
- From the Add Visualization dropdown menu, choose Select Existing Visualization or Create New Visualization, which takes you to the event analytics explorer where you can use PPL to create visualizations.
- If you're adding already existing visualizations, choose a visualization from the dropdown menu.
- Choose Add.
To search for a particular visualization in your operational panels, use PPL queries to search for data you've already added to your panel.