Observability
Observability helps you understand a system from the outside by letting you ask questions about that system without knowing its inner workings. Observability also allows you to easily troubleshoot and handle novel problems (i.e. "unknown unknowns”) and enables us to answer the question, "Why is this happening?"
Circonus Observability is a collection of analytics and tools that allows you to answer these questions by discovering, exploring, and visualizing traces, events and metric data stored within the platform.
Key Observability concepts
Service Reliability
Reliability answers the question: "Is the service doing what users expect it to be doing?” A system could be up 100% of the time, but if a user clicks the Add to Cart button to add a black pair of pants to their shopping cart, and the system keeps adding a red pair of pants, then the system would be said to be unreliable.
Telemetry refers to data emitted from a system about its behavior. The data can come in the form of traces, metrics, and logs.
Logs
A log is a timestamped message emitted by services or other components. Unlike traces, they are not necessarily associated with any particular user request or transaction. They are found almost everywhere in software and have been heavily relied on in the past by both developers and operators alike to help them understand system behavior.
Sample Log:
I, [2021-02-23T13:26:23.505892 #22473] INFO -- : [6459ffe1-ea53-4044-aaa3-bf902868f730] Started GET "/" for ::1 at 2021-02-23 13:26:23 -0800
Unfortunately, logs aren't extremely useful for tracking code execution as they typically lack contextual information, such as where they were called from.
They become far more useful when they are included as part of a span.
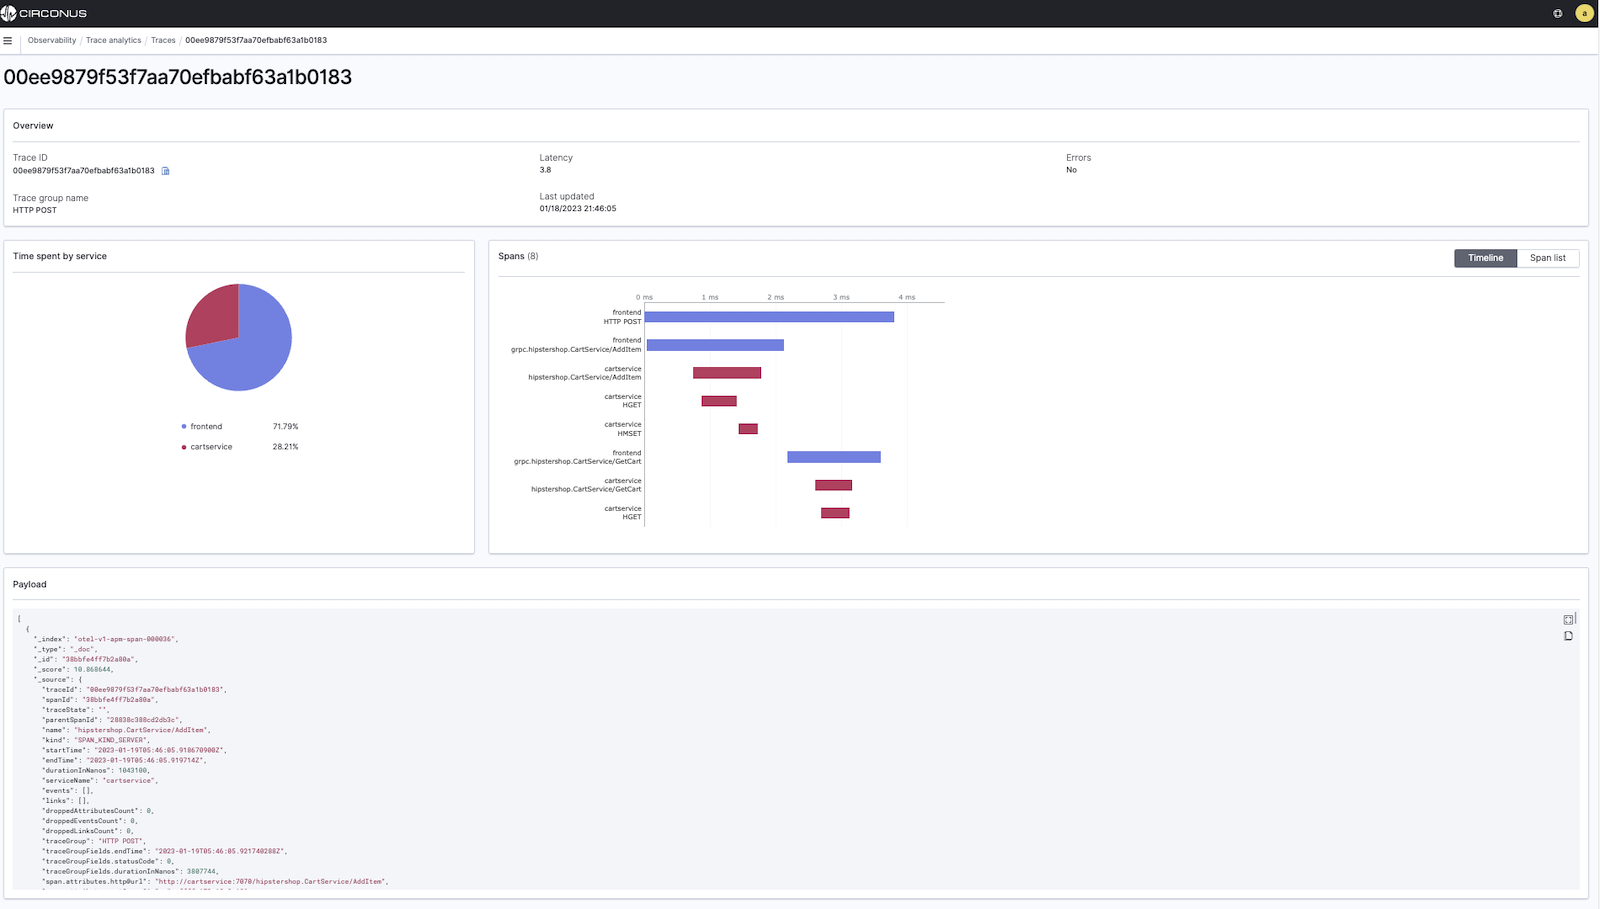
Distributed Tracing
A distributed trace, more commonly known as a trace, records the paths taken by requests (made by an application or end-user) as they propagate through multi-service architectures, like microservice and serverless applications.
Without tracing, it is challenging to pinpoint the cause of performance problems in a distributed system.
Tracing improves visibility into our application or system's health and lets us debug behavior that is difficult to reproduce locally. Tracing is essential for distributed systems, which commonly have nondeterministic problems or are too complicated to reproduce locally.
Tracing makes debugging and understanding distributed systems less daunting by breaking down what happens within a request as it flows through a distributed system.
A trace is made of one or more spans. The first span represents the root span. Each root span represents a request from start to finish. The spans underneath the parent provide a more in-depth context of what occurs during a request (or what steps make up a request).
Spans
A span represents a unit of work or operation. It tracks specific operations that a request makes, painting a picture of what happened during the time in which that operation was executed.
A span contains a name, time-related data, structured log messages, and other metadata (i.e. attributes) to provide information about the operation it tracks.
Below is a sample of the type of information that would be present in a span:
Span Attributes
| Key | Value |
|---|---|
| net.transport | IP.TCP |
| net.peer.ip | 10.244.0.1 |
| net.peer.port | 10243 |
| net.host.name | localhost |
| http.method | GET |
| http.target | /cart |
| http.server_name | frontend |
| http.route | /cart |
| http.scheme | http |
| http.host | localhost |
| http.flavor | 1.1 |
| http.status_code | 200 |
| http.user_agent | Mozilla/5.0 (Macintosh; Intel Mac OS X 10_15_7) AppleWebKit/537.36 (KHTML, like Gecko) Chrome/106.0.0.0 Safari/537.36 |
For more information on Traces see Traces in OpenTelemetry.
Getting started with Circonus Observability
If you're new to exploring data, we recommend trying a workflow like the following:
- Explore data within a certain timeframe using Piped Processing Language (PPL).
- Use Trace Analytics for at-a-glance visibility into application performance and the ability to drill down into individual distributed traces.
- Use Event Analytics to turn data-driven events into visualizations.
- Create Operational Panels and add visualizations to compare data the way you like.
- Use Log Analytics to transform unstructured log data.
- Leverage Notebooks to combine different visualizations and code blocks that you can share with team members.