Debugging CAQL Queries
In this note, we explain a few methods that can be helpful when debugging CAQL queries. In the future, we aim to provide further language tooling, like auto completion, that will help with the creation of CAQL queries.
Ask For Help
If you get stuck, don't hesitate to reach out to us via the
Circonus-Labs Slack on the #CAQL-channel, or via
email at support@circonus.com. We are typically available
during business hours in the US/East timezone.
Take One Step At a Time
Here is a typical CAQL query that consist of multiple steps:
find("duration", "and(dc:us-east)") | stats:max() | window:max(1h)
The first one is typically a data fetching operation (find).
This is followed by an aggregation (stats:max)
and data transformation (window:max).
When such a query is not working as expected, it's best to debug the individual steps one at a time.
Start with isolating the find() query, by commenting out the subsequent parts:
find("duration", "and(dc:us-east)")
// | stats:max()
// | window:max()
Is this returning the expected metrics?
If so, move on to the next line:
find("duration", "and(dc:us-east)")
| stats:max()
// | window:max()
Does this look plausible? If not, do we need to change parameters or use a different functions?
Finally re-run the full query:
find("duration", "and(dc:us-east)")
| stats:max()
| window:max()
Is the behavior explainable now?
Debugging find() Statements
In case a find() query does not return the expected results, there are a number
of things to try.
Go to the Metrics Explorer and repeat the query. Here, you have a query builder and a result list available for debugging:
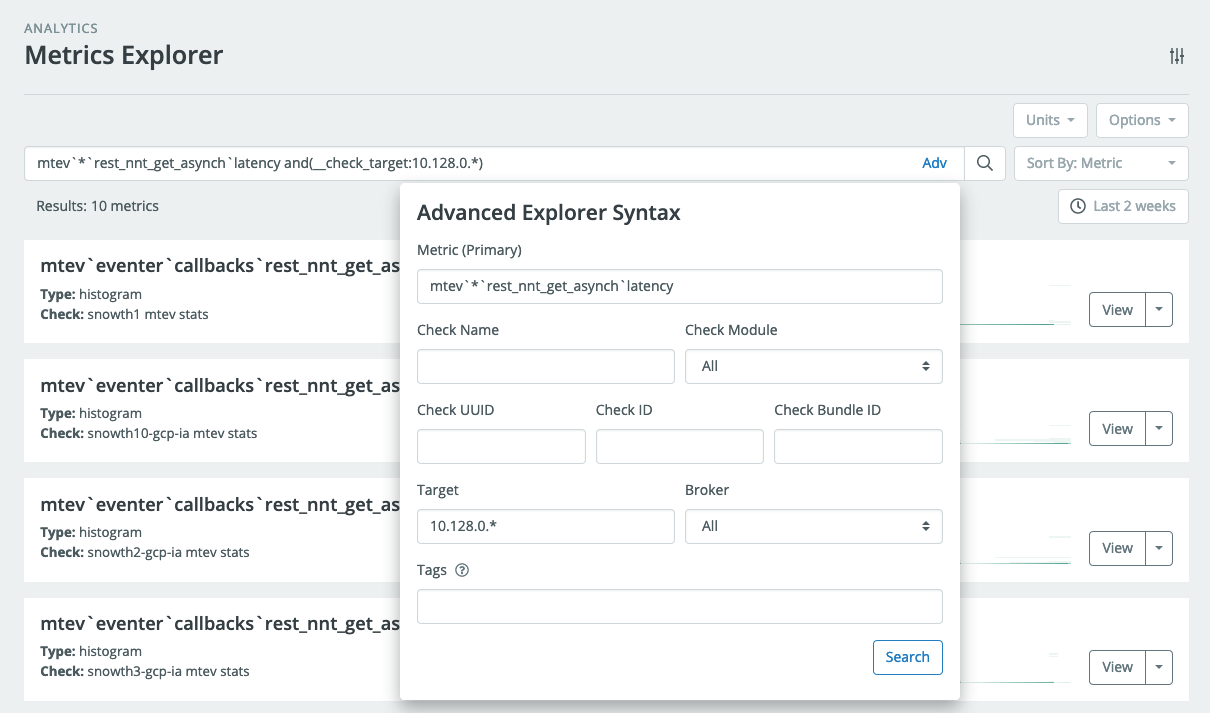
Translate the Metrics Explorer Query into a CAQL find() statement.
- Start by copy-pasting the query into the CAQL input box.
- Enclose it in a
find("...")statement - If the query uses tag search, separate the name pattern and the tag query into separate string literals.
In our example the find() query looks like so:
find("mtev`*`rest_nnt_get_asynch`latency", "and(__check_target:10.128.0.*)")
     +------ quoted name pattern -------+  +------ quoted tag query ------+
In case the search query uses special characters, you might need to percent-encode (i.e. url-encode) the string literals.
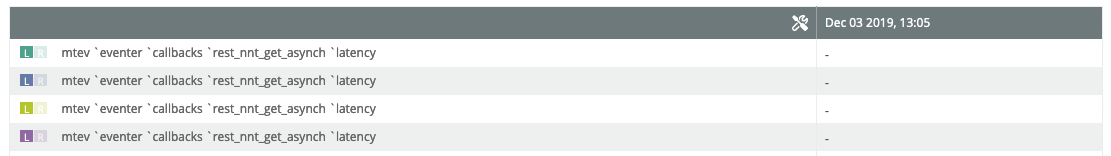
In case you are looking for histogram data, replace
find()byfind:histogram()function, to select histogram data.Flip the graph into view mode and inspect the legend. The entries should contain the metric names of the matching metrics.
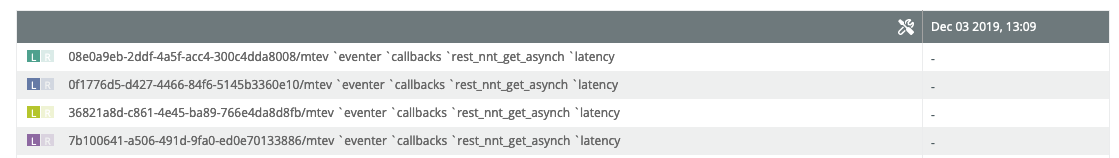
To get more precise information about the metric matches we can use the label function like so:
find("mtev`*`rest_nnt_get_asynch`latency", "and(__check_target:10.128.0.*)")
| label("%tv{__check_uuid}/%cn")
This will output the check uuid and the canonical metric name (including Stream Tags) in the legend:
If the data does not look like expected, check the selected data kind, e.g.
- To convert counts into rates, you can select the "counter" data kind using
find:counter()
- To convert counts into rates, you can select the "counter" data kind using
Selecting a Specific Metric
In debugging situations, it's sometimes useful to select data from a single
specific metric. CAQL provides the metric()
functions for this purpose which follow the pattern:
metric:$kind( "$check_uuid", "$canonical_metric_name" )
The most reliable way to fill this template is to copy this information from the Metrics page. Here is an example:
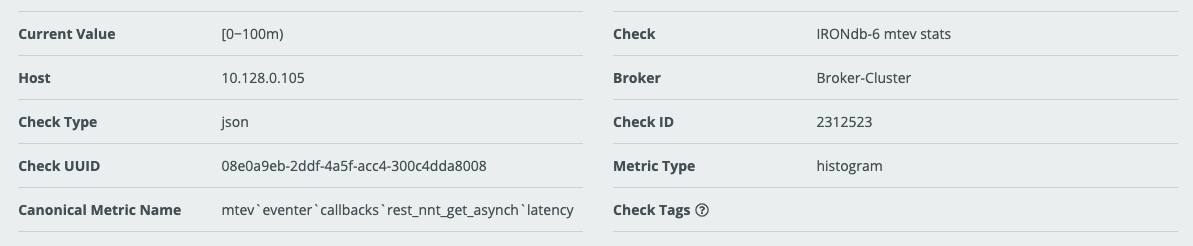
The displayed information includes the "Check UUID", "Canonical Metric Name", and "Metric Type". For this metric, the CAQL statement looks like this:
metric:histogram(
    "08e0a9eb-2ddf-4a5f-acc4-300c4dda8008",
    "mtev`eventer`callbacks`rest_nnt_get_asynch`latency"
)
Note that we replaced $kind with histogram since the Metric Type is histogram.
If Metric Type is numeric, replace $kind with average or use the short form
metric( "$check_uuid", "$canonical_metric_name" ).
Note: Some people have experienced problems with extra space characters being inserted when copying canonical metric name, from the checks page. Check that no extra space characters have crept in.
If the canonical metric name contains special characters like quotation marks, it's best to percent encode (url encode) the metric name.
In our case this would look like this:
metric:histogram(
    "08e0a9eb-2ddf-4a5f-acc4-300c4dda8008",
    p"mtev%60eventer%60callbacks%60rest_nnt_get_asynch%60latency"
   // ^ percent encoded metric name
)
Generating Synthetic Data
In some cases, you might have appropriate metric data in your account to test certain CAQL functions. Here are a few ways to generate interesting data artificially.
Generating Constant Metrics
Number literals give rise to constant metrics:
123 // constant metric with value 123Use the
pass()function to create multiple output values:pass{ 1, 2, 3 } // three metrics with values 1, 2 and 3Use the
histogram()function to create constant histograms:histogram{ 1, 2, 3 } // single, constant histogram with inserted values 1,2,3Combine
pass()andhistogram()to create multiple histogram streams:pass{
histogram{1}, // constant histogram with value 1
histogram{2}, // constant histogram with value 2
histogram{3} // constant histogram with value 3
}
Generating Monotonic Data
If constant data is not enough, the time:epoch() function provides a reliable
way to generate linear monotonic data.
time:epoch() // current UNIX epoch timestamp in seconds as numeric metric
One drawback of this function is that the values are very large, and the slope is fixed to +1/sec.
To adjust the absolute value, subtract a recent UNIX timestamp:
time:epoch() - 1575158400 // seconds since 2020-12-01 00:00 UTC
To adjust the slope divide by an appropriate value:
(time:epoch() - 1575158400) / (60 * 60) // hours since 2020-12-01 00:00 UTC
Here is an equivalent version, that is arguably more elegant:
time:epoch() | op:sub(1575158400) | op:div(3600)
Here is how that looks like:
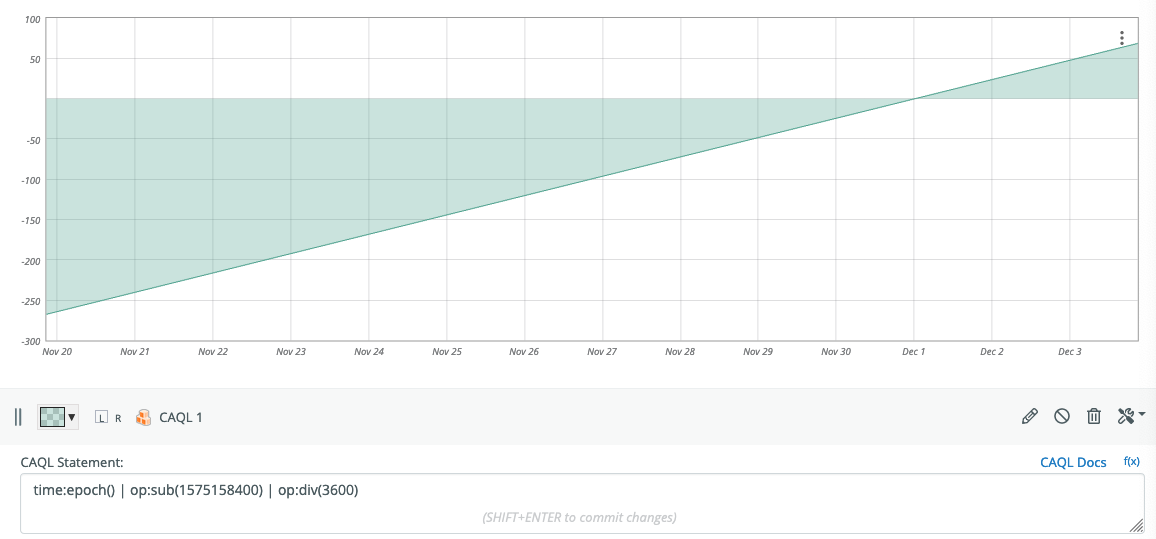
As above, this can be used to create multiple outputs or histogram versions.
Generating Periodic Data
The time:tz function can be used to generate
periodic data of different periods.
pass{
  time:tz("UTC", "minute") // minute within each hour as numeric metric [0 .. 59]
  time:tz("UTC", "hour"),  // hour within each UTC day as numeric metric [0 .. 23]
}
The following time-fields are available: hour, monthday, month, weekday,
yearday, year. Here is an example of how to combine those functions to
generate a daily periodic signal:
time:tz("UTC", "minute") + 60 * time:tz("UTC", "hour") // minute within each day
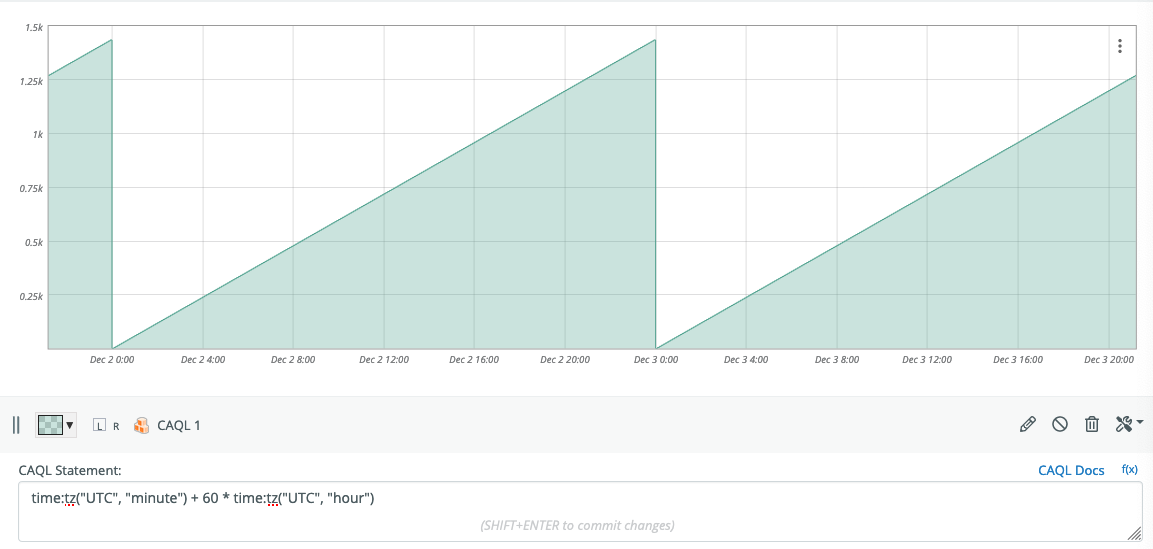
As above, this can be used to create multiple outputs, or histogram versions.
Debugging CAQL Checks and CAQL Metrics
If a CAQL check is not working as intended it's generally worth copying the query from the checks page and pasting it into a CAQL Datapoint on a graph.
If the data on the graph is not working as intended, this is usually a problem with the query itself and the general debugging methods in this document apply.
If the data on the graph is working, but the CAQL check is not outputting any data, then open a support ticket with us.
If the CAQL check is outputting data which is different from the data on the CAQL data-point on the graph, try zooming-in to a time-window of a few hours. CAQL on Graphs makes use of approximations to accelerate retrieval of data over long time periods. Viewing the CAQL query for short time windows disables most of these optimizations.
If the data still looks different, then open a support ticket with us.